HTML Canvas Apps
I have utilized the Canvas API to make numbers come alive.
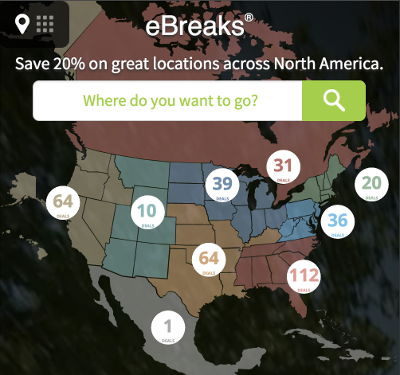
Marriott eBreaks Single Page Application
I developed the animated and interactive North American map on the
Marriott eBreaksApp. Hover and click events on geographic landmass and the animated bubbles coorespond to Marriott Hotel's network regions and launch an Angular/Foundation modal upon click. And as it is an SVG, the map looks spectacular whether it is in a mobile phone or a 60 inch TV!
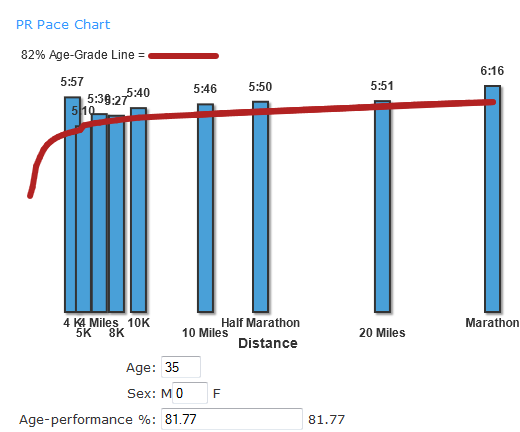
Bar Graph with HTML5 Canvas and JavaScript
This graph is generated on page load using Javascript and HTHM5 Canvas using personal record road race finish times. Manipulation of the controls below the graph dynamically changes the height and curve of the Age Grade Line.

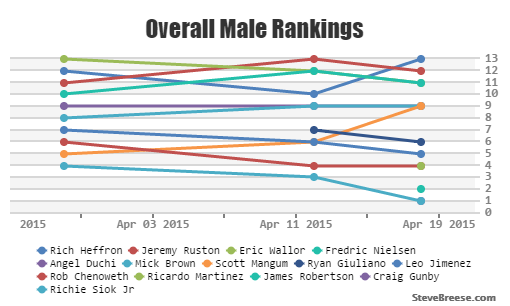
Line Graph with HTML5 Canvas and JavaScript
The
Rankings Positions Throughout the Circuitline charts are generated on page load using Javascript and HTHM5 Canvas using road racer rankings. The feature has been credited for adding a whole new level of excitement and camaraderie for athletes competing in the Chicago Area Runners Association's Runners Choice Race Circuit.

See it in action: www.RoadRacing.Rocks/Trophy-Case/Rankings-Chart.php
